Returns for the Average Investor

Stocks as a whole have fared very well compared to other asset classes. The return on the S&P-500 has outpaced bonds, homes, commodities and others, over long stretches of time. Yet, the average investor has done poorly. Take a look:
Source: JP Morgan
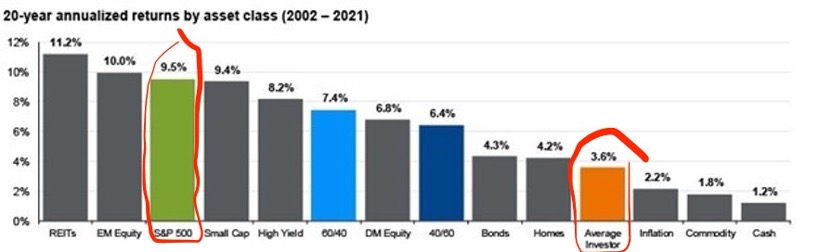
The average investor has earned an average annual return of 3.6% compared to 9.5% for the S&P-500 during a 20-year period from 2002-2021. And that 3.6% return is a ‘nominal’ return, not a ‘real’ return. Inflation, on average, over this period was 2.2%, so the real return was only 1.4%.
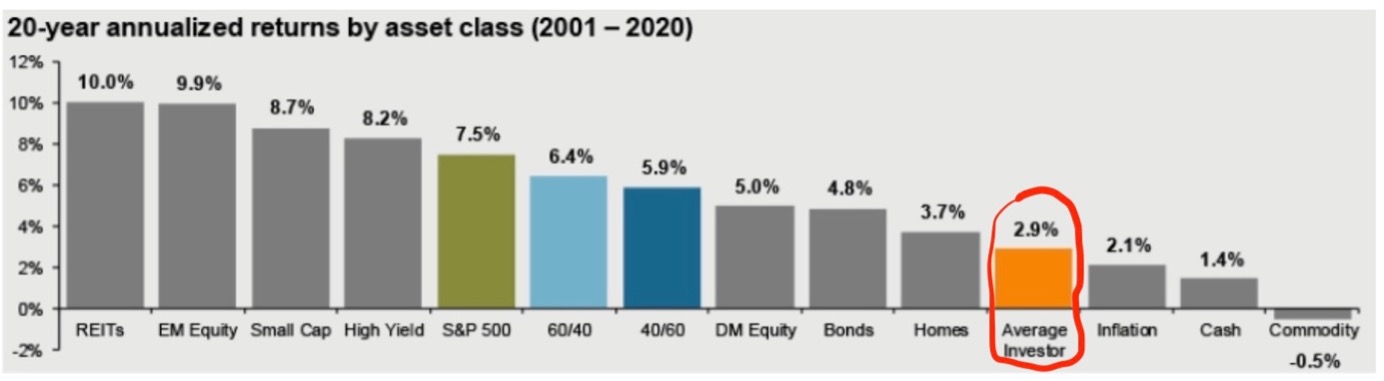
It doesn’t matter what period you want to measure; the individual investor has always fared poorly.
Source: JP Morgan
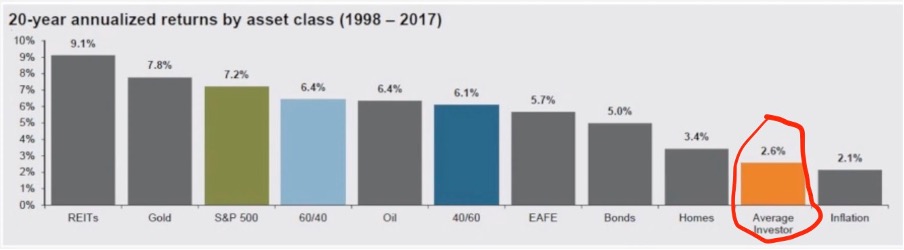
It’s sad to see investors perform so poorly, especially when it’s so easy to invest in the S&P-500. This article isn’t intended to promote investing in the S&P-500, (although that is the best strategy for 90% of investors) it is intended to explain and hopefully help you make sense of why investors do so poorly.
WHY INVESTORS DO POORLY IN THE STOCK MARKET:
The reason why you are doing poorly in the stock market isn’t because the stock market is rigged, or that you ‘are not smart enough’, it’s just that you are simply taking the wrong approach. Let me give you an analogy. Someone can be a great tennis player, or a great lawyer, doctor, etc; but you simply can’t transfer those skills if you wanted to be a chef. If you wanted to be a chef, you need a new skill set, a new ‘approach’, if you wanted to succeed. Unfortunately, a lot of retail investors have fallen victim to successful advertising and the false prospects of getting rich quick. The result is that they end up (unconsciously) adopting a gambling mindset along with the wrong approach to investing in the stock market, and, instead of getting rich quick, they get poor quicker.
On the grand scheme of things, I believe it boils down to three key reasons:
- Average holding period for common stocks is short
- Increase in trading activity
- Poor information (Survivorship Bias)
Let me start with point number 1. In the 1950’s and 1960’s, the average holding period for commons stocks was eight years. Today… it is just 5.5 months! This is alarming. This change is due for a variety of reasons, such as the rise of the internet, lower fees and commissions on trades, greater focus on short-term results and shorter company lifespans.
Now you might think that the rise of the internet and lower fees and commissions on trades benefits the retail investor. Despite the internet providing us with an influx of information that the average person couldn’t get their hands on before, the average investor does terrible. and investing in stocks, options and crypto can all be done in a click of a button. The rise of all these internet trading platforms such as Robinhood, Interactive Brokers, Etoro and others have made investing so easy.
Online brokerage makes investing much more accessible. However, just because online platforms make it easier to trade, doesn’t mean it’s more beneficial. As a matter of fact, online trading platforms benefit from increased trading activity, we do not.
Robinhood has outlined their growth strategy on their annual report. Below is a snapshot:
Notional trading volume is the total dollar value of trades that are executed over a specified time. It is in Robinhood’s best interest for customers on their platform to trade more often. Why? Because that is how Robinhood makes money.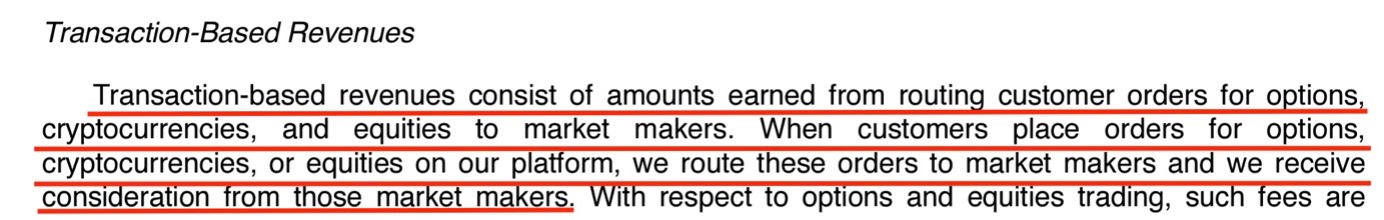
So it’s simple: The more orders that are made on the platform, the more money they make. This doesn’t just apply to Robinhood, but every brokerage firm.
Another example is Interactive Brokers. What is their main objective? They tell us. 
They earn commission from executing and processing customer orders:
Now before you think that brokers are evil and they spend their advertising dollars to encourage people to trade more often, one thing needs to be clear. There is nothing inherently wrong with brokers trying to increase customers and encourage more trading on their platforms. That is how they generate income. Unfortunately, what works best for brokers isn’t what works best for customers.
The sad reality with trading strategies is that a successful strategy will become obsolete if enough people participate in the same strategy. The idea of trading is to find an ‘edge’, which means applying an unpopular or unknown strategy that works. A popular example is Jim Simons, who adopted a successful trading strategy that achieved a compounded annual return of 66% for over 30 years! But guess what, his strategy only worked because it wasn’t publicly available. No one knows what methods he used to achieve that result.
So be careful if you see a ‘finfluencer’ and someone promoting a successful trading strategy on the internet. Observing only successful strategies is what is known as ‘survivorship bias’. Survivorship bias is a cognitive shortcut that occurs when a successful subgroup is mistaken as the entire group. This is a common reality in trading because no one shares their losses.
IT'S NOT ALL BAD NEWS:
Now if you’re like me, you probably started investing in stocks for the same reason, you got into it because you eventually wanted to quit your day job, or that you just want to build on your current income or use your savings productively. Let me give you an example: Let’s say a person works a day job and earns $70,000 a year and has $50,000 invested in the stock market which is earning an annual rate of 20% (This is hypothetical).
|
Year |
Interest |
Accrued Interest |
Balance |
|
0 |
|
|
$50,000 |
|
1 |
$10,000 |
$10,000 |
$60,000 |
|
2 |
$12,000 |
$22,000 |
$72,000 |
|
3 |
$14,400 |
$36,400 |
$86,400 |
|
4 |
$17,280 |
$53,680 |
$103,680 |
|
5 |
$20,736 |
$74,416 |
$124,416 |
|
6 |
$24,883 |
$99,299 |
$149,299 |
|
7 |
$29,860 |
$129,159 |
$179,159 |
|
8 |
$35,832 |
$164,991 |
$214,991 |
|
9 |
$42,998 |
$207,989 |
$257,989 |
|
10 |
$51,598 |
$259,587 |
$309,587 |
|
11 |
$61,917 |
$321,504 |
$371,504 |
|
12 |
$74,301 |
$395,805 |
$445,805 |
|
20 |
$319,480 |
$1,866,880 |
$1,916,880 |
This table shows you the magic of compound interest. We can see that by year 12, the interest alone this person receives is enough to replace his income, which is $70,000. The total balance went from $50,000 to $445,805. Fast forward eight years, in year 20, the interest this person earns is $319,480 – which is more than 4x his current income and his total balance is just under $2 million.
Let’s use a different example, with everything being the same, except, instead of earning an annual rate of 20%, this person earns an annual rate of 15%.
|
Year |
Interest |
Accrued Interest |
Balance |
|
17 |
$70,182 |
$488,063 |
$538,063 |
By year 17, the interest earned will be enough to replace his income, and the total balance went from $50,000 to $538,063.
Two key things you need to know about stocks is:
- A stock is a piece of a business – whenever you buy a stock, you are buying an ownership interest in that company.
- How well you do in the stock market ultimately depends on two factors:
- How good the business does over time – for example, earnings growth and return on invested capital.
- How much you paid for that business – the lower the price compared to its underlying value, the higher the return.
Now of course, brokerage firms won’t tell you that since the stock market game is designed to look more complicated than what it is. But that’s all it takes!
Join the Retail Investors Hub today and learn the timeless principles that have been applied by the worlds greatest investors for over 100 years.
Our Investing Program Teaches Evidence-Based Principles That Have Stood The Test of Time. Join Today and Start Building Your Financial Knowledge.
Free financial & investing lessons sent straight to your inbox.
We hate SPAM. We will never sell your information, for any reason.
